Q2 2021 Colorado Real Estate Market Update

The following analysis of the Metro Denver & Northern Colorado real estate market is provided by Windermere Real Estate Chief Economist Matthew Gardner. We hope that this information may assist you with making better-informed real estate decisions. For further information about the housing market in your area, please don’t hesitate to contact your Windermere Real Estate agent.

REGIONAL ECONOMIC OVERVIEW

Although the post COVID-19 job recovery took a step backward last winter, it has since picked up again, which is very pleasing to see. At the end of the second quarter, the state had recovered more than 276,000 of the 376,000+ jobs that were shed due to COVID-19. Even though employment levels are still almost 100,000 lower than the pre-pandemic peak, they are heading in the right direction. Looking at the markets contained in this report, current employment levels in Colorado Springs are only 2.2% below the pre-pandemic peak, followed by Denver and Fort Collins, which are both down 3.6% from the 2020 peak. I would add that all markets showed jobs continuing to return. With total employment levels rising, the unemployment rate stands at 6.2%, down from the pandemic peak of 12.1%. Regionally, unemployment levels range from a low of 4.8% in Boulder to a high of 6.3% in Grand Junction. COVID-19 infection rates dropped during the quarter, which is certain to lead to employment levels continuing to rise unless we see another significant increase in infection rates due to the rise of new variants across the country.


COLORADO HOME SALES

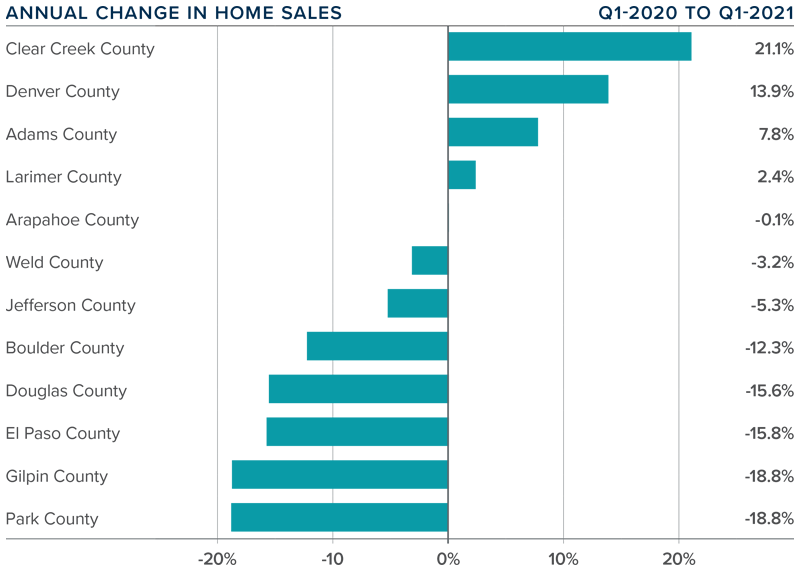
❱ The late spring/early summer market was a good one for home sales, which were up 33.9% from a year ago. Comparing the current quarter to a period when COVID-19 was widespread is not that informative, but, with sales up more than 55% from the first quarter of this year, the market appears to be very buoyant.

❱ Sales were higher in all counties other than the very small Clear Creek County. Where sales rose, they did so at double-digit rates in all markets other than Weld.

❱ During the second quarter, 13,428 homes sold. This is very impressive but not overly surprising, given that the average number of homes for sale was up 45% from the first quarter.

❱ Another positive was that pending sales, which are an indicator of future closings, were 42.8% higher than in the first quarter. This suggests that closings next quarter should be positive as well.
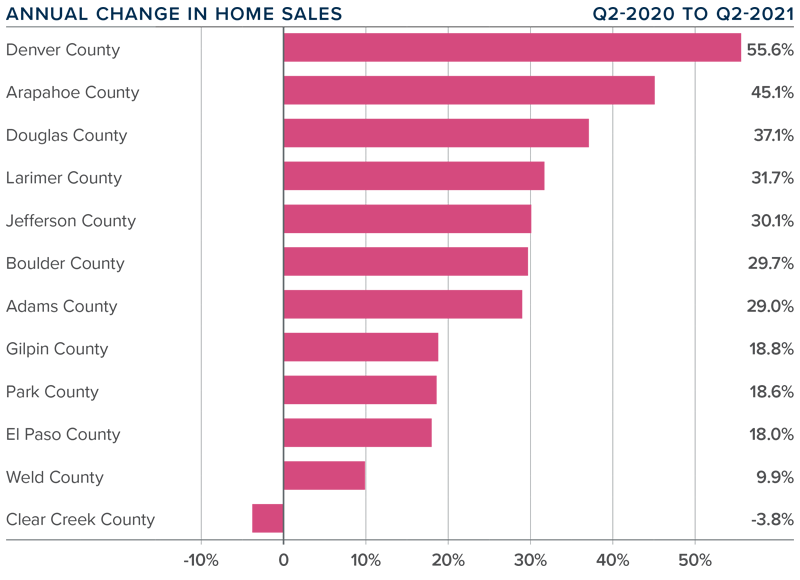
 

A bar graph showing the annual change in home sales for various counties in Colorado.


COLORADO HOME PRICES

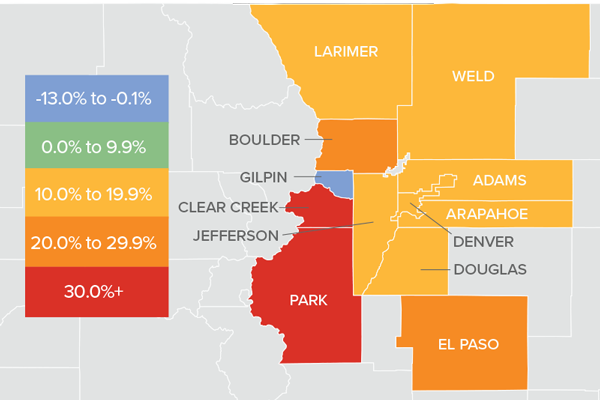
A map showing the real estate market percentage changes in various counties in Colorado.

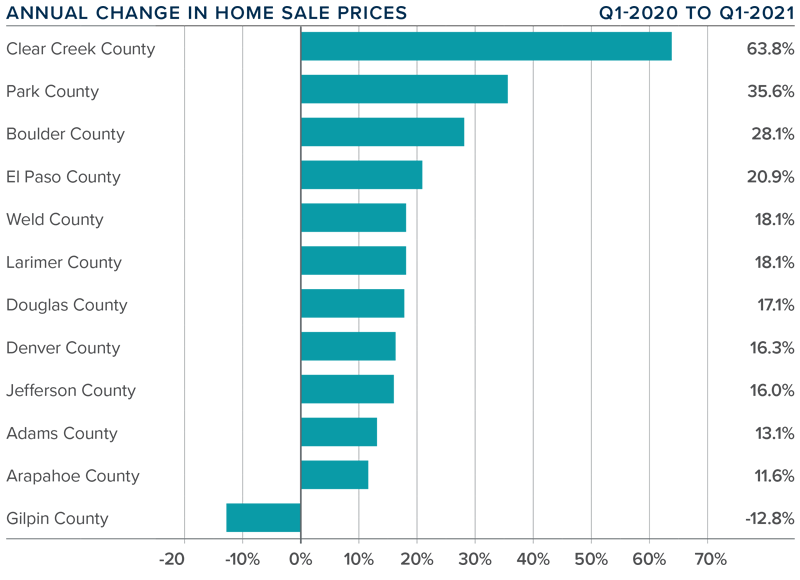
❱ Prices continue to appreciate at an impressive pace, recording an increase of 28.1% year over year to an average of $615,409. Home prices were also 10.7% higher than the first quarter of this year.

❱ Buyer demand remains very strong, likely exacerbated by the drop in mortgage rates in the second quarter and improving levels of inventory.

❱ Year-over-year, prices rose across all markets covered by this report, with the exception of Clear Creek County. Of the markets that saw prices rise, all did so by double digits, with very notable gains in Boulder, Gilpin, and Park counties.

❱ Affordability levels continue to trouble me, and the pace of price appreciation has to slow at some point. The market is clearly still out of balance, but as long as the credit quality of buyers remains high, I do not see any cause for concern.
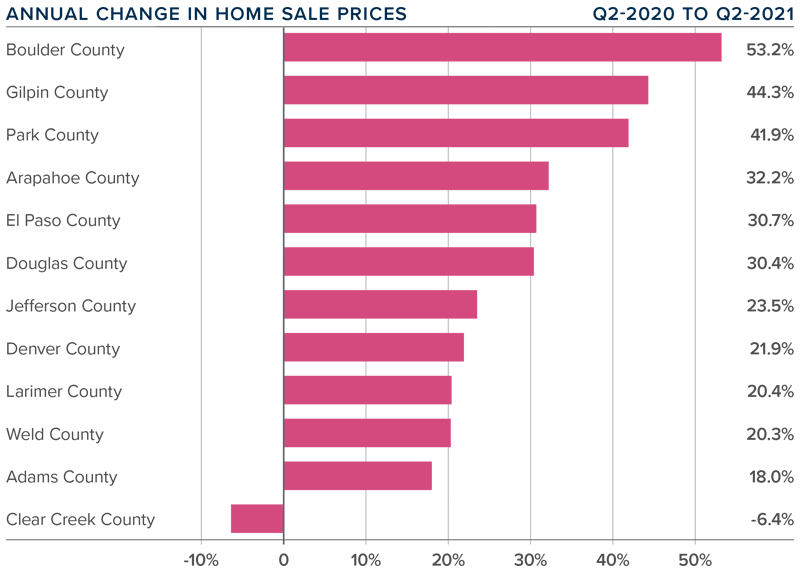
 

A bar graph showing the annual change in home sale prices for various counties is Colorado.


DAYS ON MARKET

❱ The average number of days it took to sell a home in the markets contained in this report dropped 14 days compared to the second quarter of 2020.

❱ The amount of time it took to sell a home dropped in every county contained in this report compared to the second quarter of 2020. The exception was Gilpin County, where it rose by only two days.

❱ It took an average of only 14 days to sell a home in the region, which is down 11 days compared to the first quarter of this year.

❱ The Colorado housing market remains very tight, as demonstrated by the fact that it took less than a month for homes to sell in every county other than one.
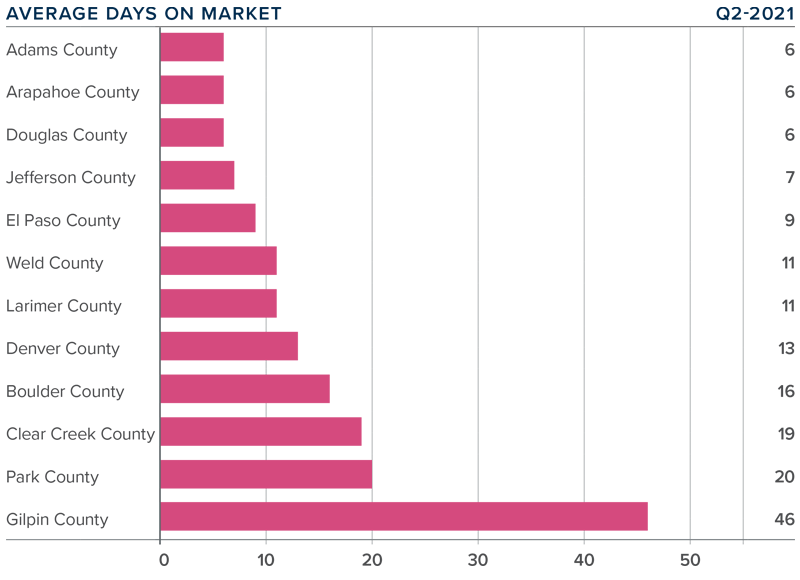
 

A bar graph showing the average days on market for homes in various counties in Colorado.


CONCLUSIONS

A speedometer graph indicating a seller's market in Colorado.

This speedometer reflects the state of the region’s real estate market using housing inventory, price gains, home sales, interest rates, and larger economic factors.
Sales rose on the back of lower mortgage rates and higher levels of homes available to buy. Although this should signify a move back to a more balanced market, we are not there yet as price growth remains well above the long-term average.

With solid demand and favorable financing rates, the market is expected to remain active as we move through the balance of the year. That said, housing affordability is becoming an increasingly large concern. According to the Colorado Association of REALTORS®, statewide affordability for single-family homes has dropped almost 20% year-over-year and is down 17.8% for multi-family homes.

At some point, an affordability ceiling will be reached, which will slow home-price appreciation—but not yet. As such, I am moving the needle a little more in favor of home sellers, as they remain in the driver’s seat, for now.


ABOUT MATTHEW GARDNER

Matthew Gardner - Chief Economist for Windermere Real Estate

As Chief Economist for Windermere Real Estate, Matthew Gardner is responsible for analyzing and interpreting economic data and its impact on the real estate market on both a local and national level. Matthew has over 30 years of professional experience both in the U.S. and U.K.

In addition to his day-to-day responsibilities, Matthew sits on the Washington State Governors Council of Economic Advisors; chairs the Board of Trustees at the Washington Center for Real Estate Research at the University of Washington; and is an Advisory Board Member at the Runstad Center for Real Estate Studies at the University of Washington where he also lectures in real estate economics.

The post Q2 2021 Colorado Real Estate Market Update appeared first on Windermere Colorado REALTORS.

100 / 90 / 60

As you’ve probably heard, prices have gone up quite a bit along the Front Range.

Low interest rates, strong demand, lower supply, and a healthy local economy are all contributing to increased prices.

It may interest you to see exactly how much prices have increased since one year ago in the markets where we have the most activity.

Over the last year, Weld County has increased roughly $100,000, Metro Denver $90,000 and Larimer County $60,000.

Specifically, here are the average prices one year ago vs. today:

  • Weld County = $426,000 vs. $523,000
  • Metro Denver = $523,000 vs. $612,000
  • Larimer County = $532,000 vs. $592,000

The post 100 / 90 / 60 appeared first on Windermere Colorado REALTORS.
Listing Averages

While a lot of attention has been paid to increasing sales prices along the Front Range, it is also interesting to look at the average price of properties currently listed for sale.

Did you know, for instance, that the average list price of all the properties currently for sale in Metro Denver is $887,000. Meanwhile, the average closed sales price is $613,000.

In Larimer County it is $793,000 versus an average closed sales price of $601,000.

In Weld County it is $669,000 versus $488,000.

What is causing this? The high number of high-end properties currently for sale pulling up the average.

You might be surprised to hear the number of $1,000,000-plus listings active listings in our market looks like this:

  • Metro Denver = 527
  • Larimer County = 75
  • Weld County = 44

The post Listing Averages appeared first on Windermere Colorado REALTORS.
Local Nuances

“All markets are local” is a commonly used phrase in real estate.

This adage is proving to be true as we notice slight changes recently in the market.

Bottom line, the market, in some locations, is not behaving exactly like it did even 30 days ago. Properties that perhaps would have received 10 or more offers last month, are now receiving only one.

It is as important as ever to examine not only the general market area, but also hyper-local markets in order to understand the nuances that exist in specific locations.

A common activity we perform with our clients is to research the months of supply in their own neighborhood. We will frequently find that this stat varies considerably from the market as a whole.

To illustrate how ‘all markets are local,’ take a look at the days of inventory statistic for the following markets:

Larimer County = 18 days
Fort Collins = 15 days
80521 Zip Code = 24 days
80525 Zip Code = 9 days

While data on the overall market clarifies overall trends, it is the hyper-local research that is incredibly valuable when pricing property.

The post Local Nuances appeared first on Windermere Colorado REALTORS.
High Average

If you watch the weekly statistics that we produce and post on social media, a number that might be jumping off the screen at you is the average price.

Specifically, it is the percentage increase in average price versus last year that is striking.

We are commonly asked ‘how could average prices increase 20% to 30% in one year?’

It is important to note prices haven’t appreciated up to 30%, it’s only the average price that has increased by that amount.

A key reason why average prices have increased by such a significant amount is that there are many more luxury properties selling this year versus last year.

Sales of properties priced over $1,000,000 have seen a substantial increase compared to 2020.

Look at these numbers which show the year over year increase in closed transactions for real estate priced over $1 million:

  • Larimer County = 159%
  • Weld County = 247%
  • Metro Denver = 137%

So, transactions of luxury properties have much more than doubled compared to 2020 which is pulling up the average sales price in a significant way.

The post High Average appeared first on Windermere Colorado REALTORS.
Want a house in Fort Collins? Grab $500,000, get in line and join the housing Hunger Games

“Buying a house in Fort Collins these days can feel like a combat sport. Maybe more like the

‘Hunger Games.’ Or Charlie Brown and the football — every time you get close to the ball,

Lucy whisks it away…”


Pat Ferrier at the Fort Collins Coloradoan breaks down the housing market in Northern Colorado with the help real estate professionals across the front range. Click the link below to read on!


Fort Collins real estate_ Average home price near $500K in market

The post Want a house in Fort Collins? Grab $500,000, get in line and join the housing Hunger Games appeared first on Windermere Colorado REALTORS.
Q1 2021 Colorado Real Estate Market Update

The following analysis of the Metro Denver & Northern Colorado real estate market is provided by Windermere Real Estate Chief Economist Matthew Gardner. We hope that this information may assist you with making better-informed real estate decisions. For further information about the housing market in your area, please don’t hesitate to contact your Windermere Real Estate agent.

REGIONAL ECONOMIC OVERVIEW

Following the decline in employment last winter, Colorado has started to add jobs back into its economy. The latest data shows that the state has now recovered more than 219,000 of the 376,000+ jobs that were lost due to COVID-19. This is certainly positive, but there is a long way to go to get back to pre-pandemic employment levels. Denver and Fort Collins continue to have the greatest improvement in employment, but all markets show job levels well below pre-pandemic levels. With total employment levels rising, the unemployment rate stands at 6.6%, down from the pandemic peak of 12.1%. Regionally, unemployment levels range from a low of 5.6% in Fort Collins and Boulder to a high of 6.7% in Greeley. COVID-19 infection rates have started to increase again, and this has the potential to negatively impact the job market. I am hopeful that the state will not be forced to pull back reopening, but this is certainly not assured.

COLORADO HOME SALES

❱ 2021 started off on a bit of a sour note, with total sales down 1.2% compared to the same period in 2020. Sales were 29.2% lower than in the final quarter of 2020 as 8,645 homes sold.

❱ Sales were higher in four of the counties contained in this report, were essentially flat in one, and dropped in seven. It was pleasing to see significant sales growth in the large counties of Denver and Adams.

❱ Another positive was that pending sales, which are an indicator of future closings, were 4.8% higher than in the fourth quarter of 2020 and 5% higher than a year ago.

❱ The disappointing number of home sales overall can primarily be attributed to the woeful lack of inventory. Listings in the quarter were down more than 61% year over year and were 40.6% lower than in the fourth quarter of 2020.


COLORADO HOME PRICES

❱ Prices continue to appreciate at a very rapid pace, with the average sale price up 16.5% year over year, to an average of $556,100. Home prices were also 4.4% higher than in the fourth quarter of 2020.

❱ Buyers appear to be out in force, and this demand—in concert with very low levels of inventory—continues to heat the market.

❱ Prices rose over last year across all markets covered by this report, with the exception of the very small Gilpin County. All other counties saw sizeable gains and the trend of double-digit price growth continued unabated.

❱ Affordability levels are becoming a greater concern as prices rise at a far faster pace than wages. Even though mortgage rates have started to rise, they haven’t yet reached the level needed to take some of the heat out of the market.


DAYS ON MARKET

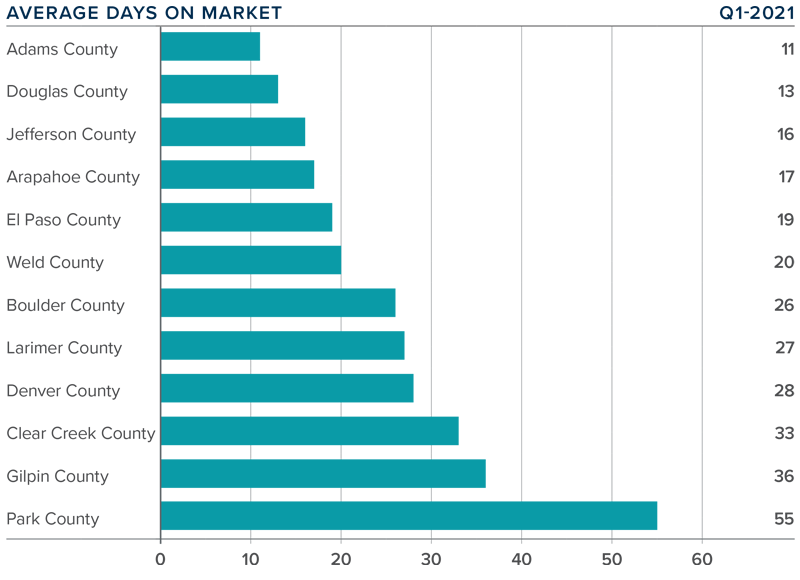
❱ The average time it took to sell a home in the markets contained in this report dropped 20 days compared to the first quarter of 2020.

❱ The amount of time it took to sell a home dropped in every county contained in this report compared to the fourth quarter of 2020.

❱ It took an average of 25 days to sell a home in the region, down one day from the fourth quarter of 2020.

❱ The Colorado housing market remains very tight, as demonstrated by the fact that it took less than a month for homes to sell in all but two counties.


CONCLUSIONS

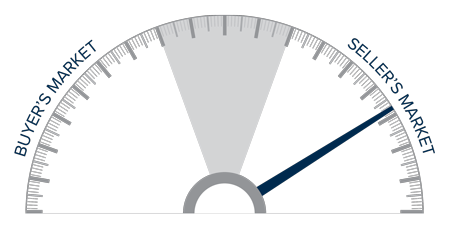
This speedometer reflects the state of the region’s real estate market using housing inventory, price gains, home sales, interest rates, and larger economic factors.

The relatively low level of home sales is not a surprise given how few choices there are for buyers. Sellers are certainly benefitting from strong demand, as demonstrated by the significant price growth. I maintain my belief that there will be an increase in inventory as we move through the year, but it is highly unlikely that we will see a balanced market in 2021.

Given these factors, I am moving the needle a little more in favor of sellers, as demand is likely to continue to exceed supply.

ABOUT MATTHEW GARDNER

As Chief Economist for Windermere Real Estate, Matthew Gardner is responsible for analyzing and interpreting economic data and its impact on the real estate market on both a local and national level. Matthew has over 30 years of professional experience both in the U.S. and U.K.

In addition to his day-to-day responsibilities, Matthew sits on the Washington State Governors Council of Economic Advisors; chairs the Board of Trustees at the Washington Center for Real Estate Research at the University of Washington; and is an Advisory Board Member at the Runstad Center for Real Estate Studies at the University of Washington where he also lectures in real estate economics.

The post Q1 2021 Colorado Real Estate Market Update appeared first on Windermere Colorado REALTORS.

Q4 2020 Colorado Real Estate Market Update

The following analysis of the Metro Denver & Northern Colorado real estate market is provided by Windermere Real Estate Chief Economist Matthew Gardner. We hope that this information may assist you with making better-informed real estate decisions. For further information about the housing market in your area, please don’t hesitate to contact your Windermere agent.


REGIONAL ECONOMIC OVERVIEW

The job recovery that appeared to be firmly in place in the summer has started to wane. Though Colorado has recovered more than 209,000 of the jobs lost due to COVID-19, employment levels remain almost 210,000 below the level seen last February. Even with employment growth stalling, the unemployment rate stands at a relatively respectable 6.4%, down from a peak of 12.2%. Regionally, unemployment levels range from a low of 5.4% in Boulder to a high of 6.9% in Greeley. Rising COVID-19 infection rates continue to impact the job recovery, and I do not see much in the way of palpable improvement until a vaccine becomes freely available, likely in the second half of this year.

COLORADO HOME SALES

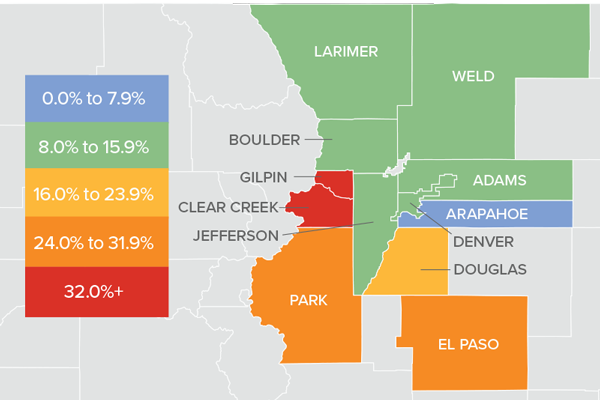
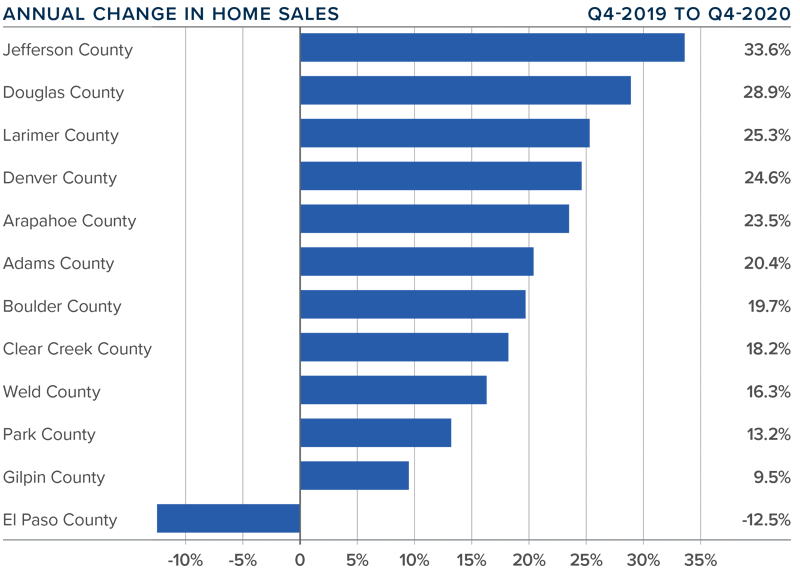
❱ In the final quarter of 2020, 12,207 homes sold. This represents an increase of 21.8% compared to the fourth quarter of 2019, but 19% lower than in the third quarter. I am not concerned, though, because seasonal influences tend to impact sales in the winter.

❱ Sales rose in all markets other than El Paso compared to the fourth quarter of 2019. I believe sales are only limited by the number of homes on the market.

❱ Inventory levels remain well below what I would like to see. The average number of homes on the market in the fourth quarter was down 55% from the same period in 2019.

❱ Pending sales were 34% lower compared to the third quarter. Again, seasonality and a lack of homes to buy impact this figure. Pending sales are still 13% higher than a year ago.

Colorado Counties Graph

COLORADO HOME PRICES

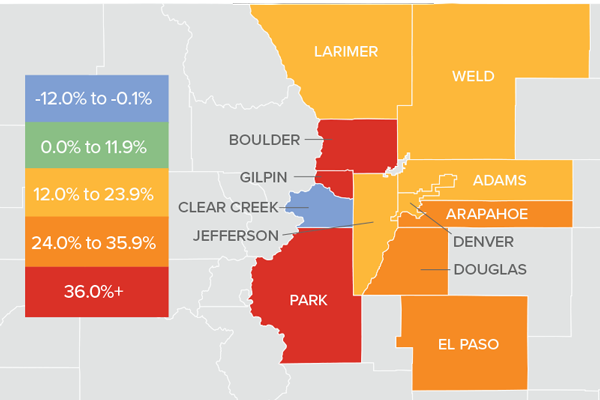
Price appreciation in various Colorado counties.

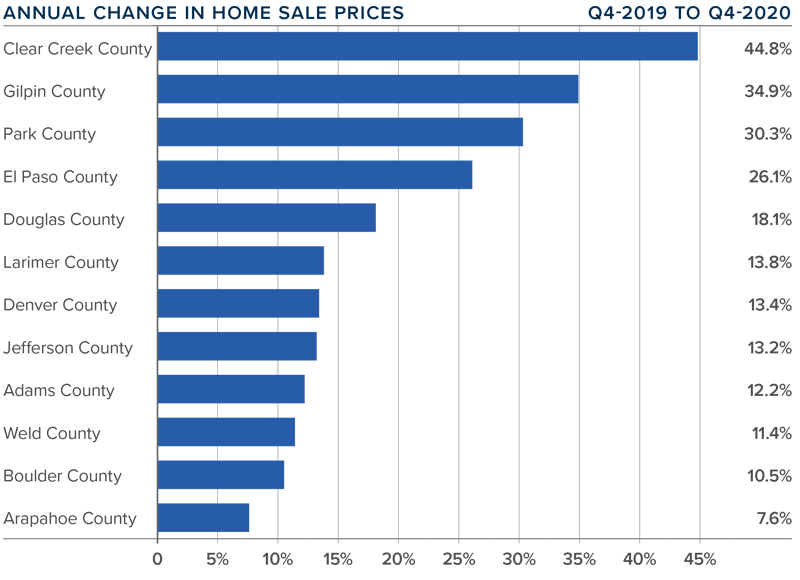
❱ Home prices rose significantly in the fourth quarter, with the average price increasing 13.7% year-over-year to $532,492. Prices were up 1.8% compared to the third quarter of this year.

❱ Interest rates are unlikely to drop much further and this will lead price growth to slow as we move through 2021.

❱ Year-over-year, prices rose across all markets covered by this report, with significant appreciation in Clear Creek, Gilpin, Park, and El Paso counties. Every county but Arapahoe saw double-digit price gains.

❱ Affordability in many Colorado markets remains a concern as prices continue to rise at well-above-average rates. That said, I anticipate we will see price growth moderate in 2021.

A bar graph showing the annual change in home sale prices in various Colorado counties.

DAYS ON MARKET

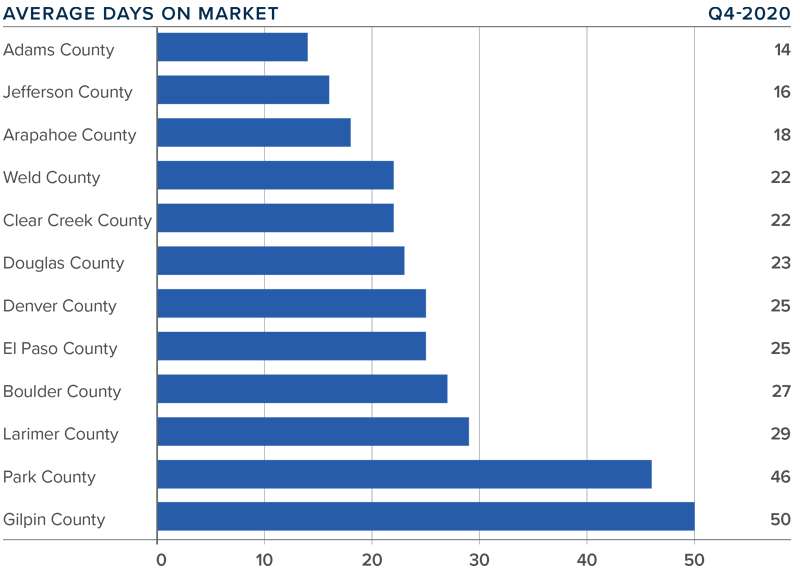
❱ The average number of days it took to sell a home in the markets contained in this report dropped 15 days compared to the final quarter of 2019.

❱ The amount of time it took to sell a home dropped in every county contained in this report compared to the fourth quarter of 2019.

❱ It took an average of 26 days to sell a home in the region, down 3 days compared to the third quarter of 2020.

❱ The Colorado housing market continues to demonstrate solid demand, and buyers are clearly competitive as suggested by the short length of time it is taking to sell a home.

A bar graph showing the average days on market for homes in various Colorado counties

CONCLUSIONS

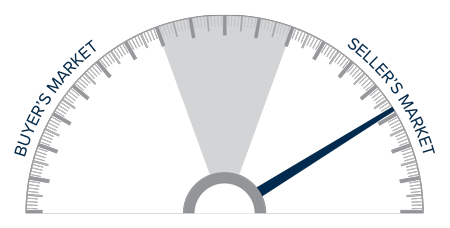
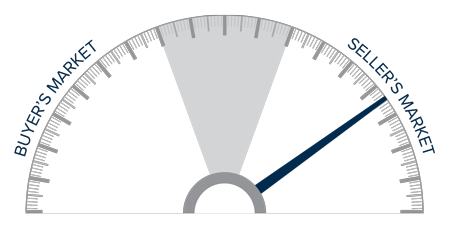
A speedometer graph indicating a seller's market in Colorado.

This speedometer reflects the state of the region’s real estate market using housing inventory, price gains, home sales, interest rates, and larger economic factors.

Home sales and prices are significantly higher than a year ago, and demand for housing is very much in place. Naturally, this favors home sellers who are still in control of the market. I do expect to see some improvement in listing activity this year, which, in concert with modestly rising interest rates, will likely start to take some of the steam out of the market. However, any moderation in the market has yet to appear. Even given the possible headwinds mentioned above, I am moving the needle a little more in favor of sellers, as demand is likely to exceed supply for the time being.


ABOUT MATTHEW GARDNER

Matthew Gardner - Chief Economist for Windermere Real Estate

As Chief Economist for Windermere Real Estate, Matthew Gardner is responsible for analyzing and interpreting economic data and its impact on the real estate market on both a local and national level. Matthew has over 30 years of professional experience both in the U.S. and U.K.

In addition to his day-to-day responsibilities, Matthew sits on the Washington State Governors Council of Economic Advisors; chairs the Board of Trustees at the Washington Center for Real Estate Research at the University of Washington; and is an Advisory Board Member at the Runstad Center for Real Estate Studies at the University of Washington where he also lectures in real estate economics.

The post Q4 2020 Colorado Real Estate Market Update appeared first on Windermere Colorado REALTORS.
How to Price Your Home for Sale

Sellers

It’s natural for sellers to want to get every step of the selling process right, but a successful home sale depends on an accurate listing price. Your real estate agent will work closely with you to set the price, but in the meantime, you can use the following information to better understand what goes into this process.


What factors influence home prices?

 Understanding what factors influence home prices will give you a deeper knowledge of the market, give clarity to the selling process, and help you work toward the accurate listing price of your home.

Comparable home sales

Comparable home sales—or “comps”—have a major impact on the price of your home. Comps refer to the comparable homes in your area, both pending and sold, within the last six months. Your Windermere agent can provide you with a Comparative Market Analysis (CMA) to better determine the price of your home. CMAs factor in aspects, such as square footage, age, and lot size compared to other homes in your area, to determine how your home should be priced among the competition.

Your home’s location

Naturally, you home’s location plays a significant role in its asking price. Depending on the market conditions in your area, whether you reside in a metropolitan, suburban, or rural location, and the home’s proximity to amenities, schools, and entertainment all contribute to the price.

The home’s condition

If you have recently invested in upgrades or other maintenance projects for your home, they could increase your asking price. However, the price increase potential depends on the kind of renovation, its ROI, and how valuable it is to buyers in your area. If the home is in need of repair, it will likely fetch less interest than better-maintained homes at your price point. Any outstanding repairs or projects looming overhead will make the home less attractive to buyers and could lead to a low appraisal.

Seasonality

Any factors that impact market supply and demand are worth taking into consideration when preparing to price your home, and seasonality is one that cannot be overlooked. Typically, market activity slows in the winter and picks up during the spring and summer months. However, market seasonality varies region to region. Talk to your Windermere agent about the seasonality trends in your area and how they factor into your asking price. 

 Market conditions

Naturally, all sellers want to price their home competitively, but what a competitive price looks like depends on the market conditions, such as whether it’s a buyer’s or seller’s market. Some sellers think that pricing their home over market value means they’ll sell for more money, but the opposite is often true. Overpricing your home presents various dangers, such as sitting on the market too long, which can result in selling for well below what it’s worth.


What’s your home worth?

 Nothing can replace the professional knowledge and local expertise of a real estate agent, but automated valuation models (AVMs) can be a helpful first step in determining what your home is worth. Like comps, AVMs assess your home by comparing its information with the listings in your area.

If you’re curious about your home’s value, Windermere offers a tool that provides a series of evaluations on your property and the surrounding market. You can find it here.

These are the basic tenets for understanding what goes into the price of a home. When you’re ready, we’re happy to connect you with an agent who can interpret and expand on this information, perform a CMA for your home, and be the expert in your selling journey.

The post How to Price Your Home for Sale appeared first on Windermere Colorado REALTORS.