The following analysis of the Metro Denver & Northern Colorado real estate market is provided by Windermere Real Estate Chief Economist Matthew Gardner. We hope that this information may assist you with making better-informed real estate decisions. For further information about the housing market in your area, please don’t hesitate to contact your Windermere Real Estate agent.
REGIONAL ECONOMIC OVERVIEW
Although the post COVID-19 job recovery took a step backward last winter, it has since picked up again, which is very pleasing to see. At the end of the second quarter, the state had recovered more than 276,000 of the 376,000+ jobs that were shed due to COVID-19. Even though employment levels are still almost 100,000 lower than the pre-pandemic peak, they are heading in the right direction. Looking at the markets contained in this report, current employment levels in Colorado Springs are only 2.2% below the pre-pandemic peak, followed by Denver and Fort Collins, which are both down 3.6% from the 2020 peak. I would add that all markets showed jobs continuing to return. With total employment levels rising, the unemployment rate stands at 6.2%, down from the pandemic peak of 12.1%. Regionally, unemployment levels range from a low of 4.8% in Boulder to a high of 6.3% in Grand Junction. COVID-19 infection rates dropped during the quarter, which is certain to lead to employment levels continuing to rise unless we see another significant increase in infection rates due to the rise of new variants across the country.
COLORADO HOME SALES
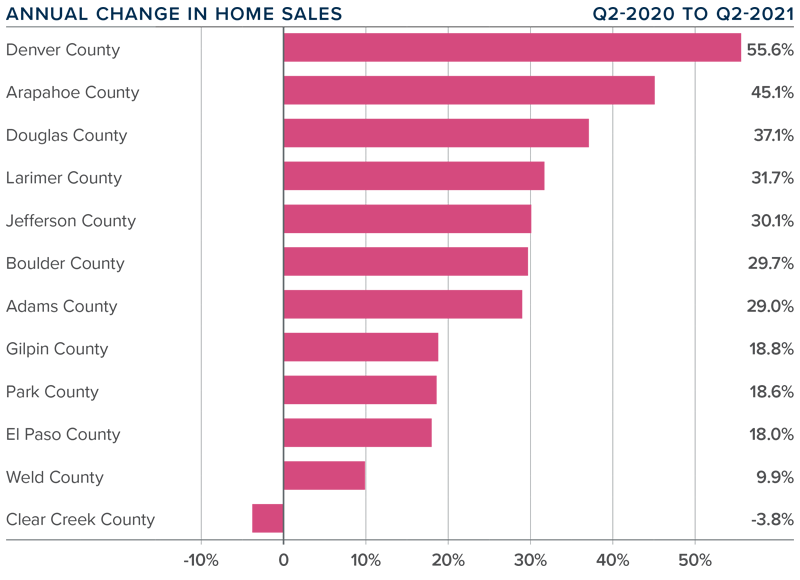
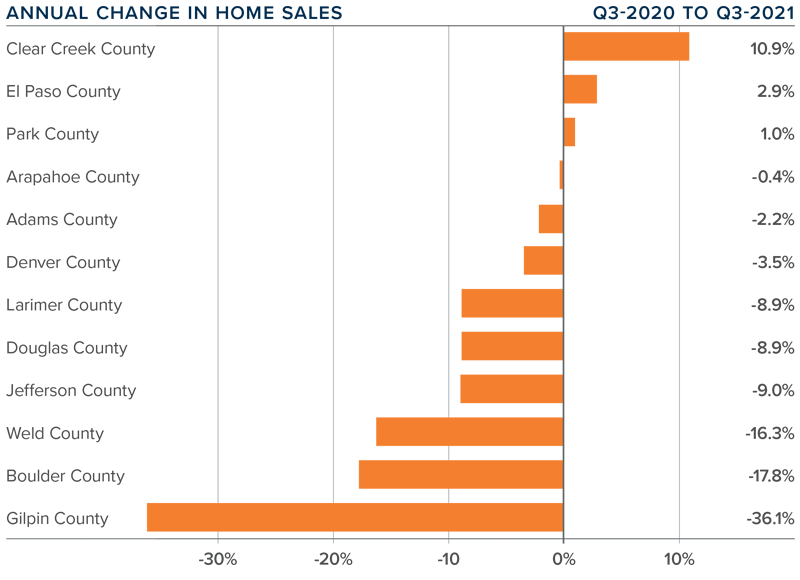
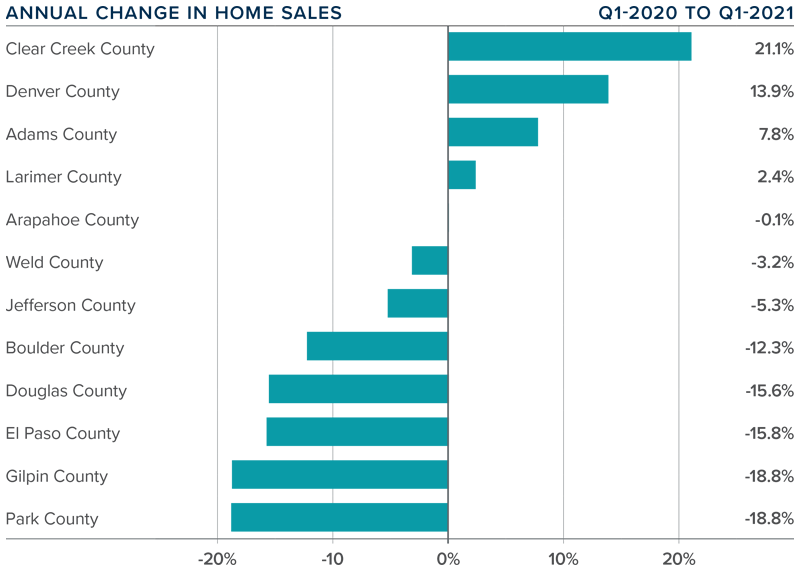
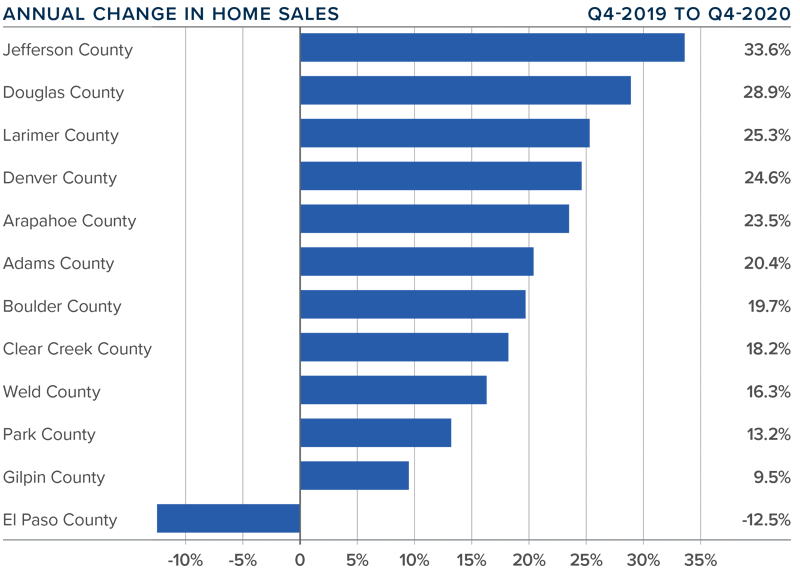
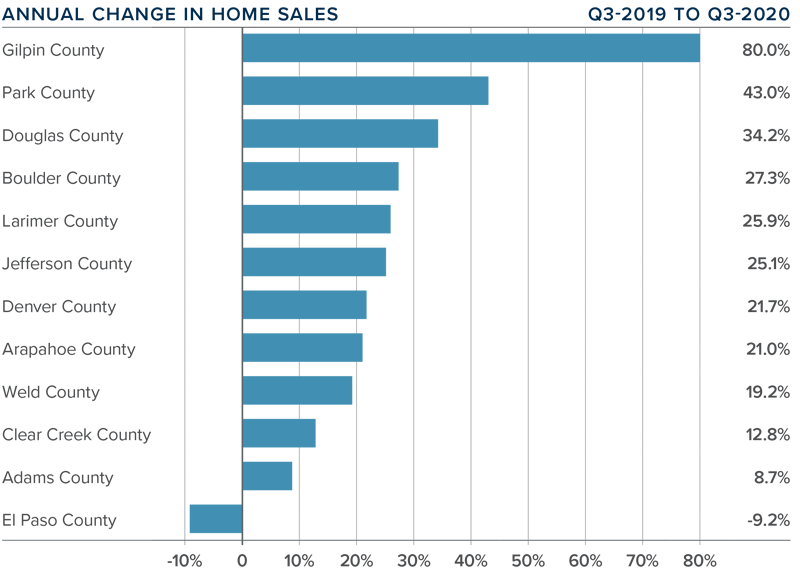
❱ The late spring/early summer market was a good one for home sales, which were up 33.9% from a year ago. Comparing the current quarter to a period when COVID-19 was widespread is not that informative, but, with sales up more than 55% from the first quarter of this year, the market appears to be very buoyant.
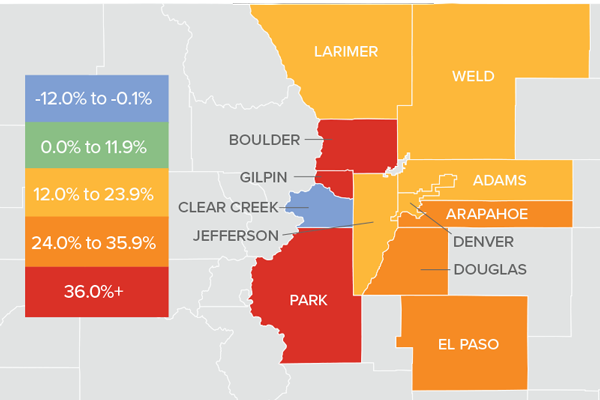
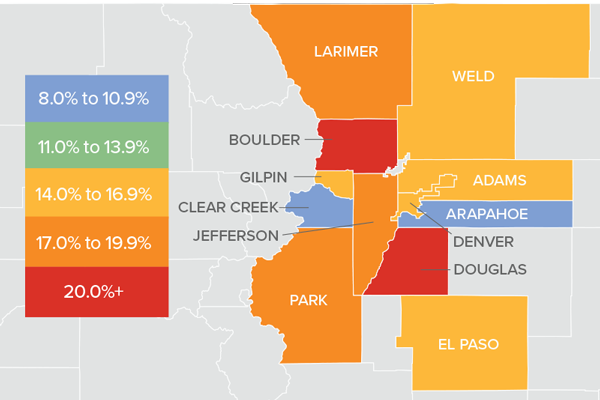
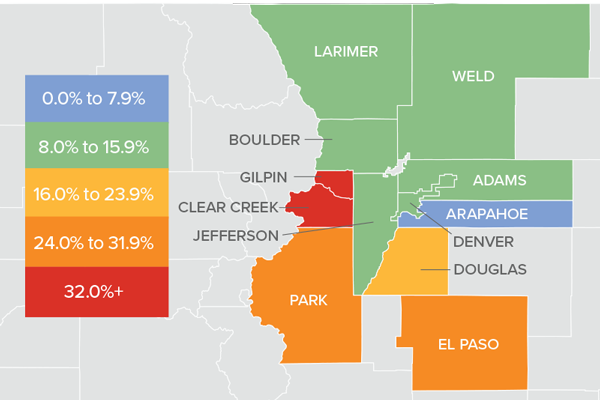
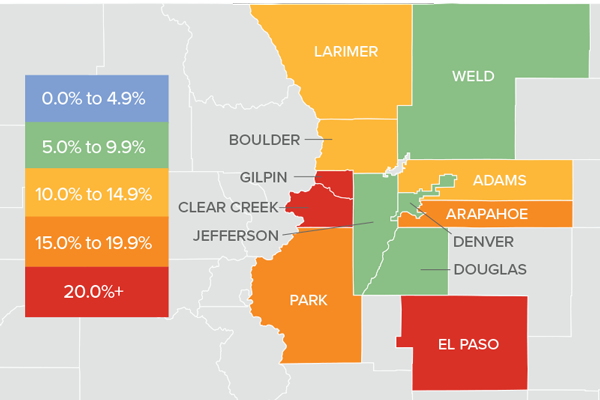
❱ Sales were higher in all counties other than the very small Clear Creek County. Where sales rose, they did so at double-digit rates in all markets other than Weld.
❱ During the second quarter, 13,428 homes sold. This is very impressive but not overly surprising, given that the average number of homes for sale was up 45% from the first quarter.
❱ Another positive was that pending sales, which are an indicator of future closings, were 42.8% higher than in the first quarter. This suggests that closings next quarter should be positive as well.
COLORADO HOME PRICES
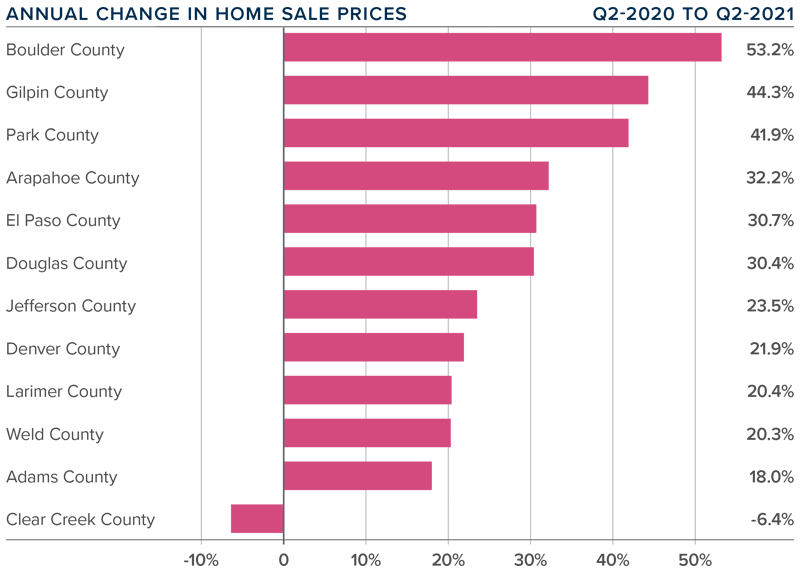
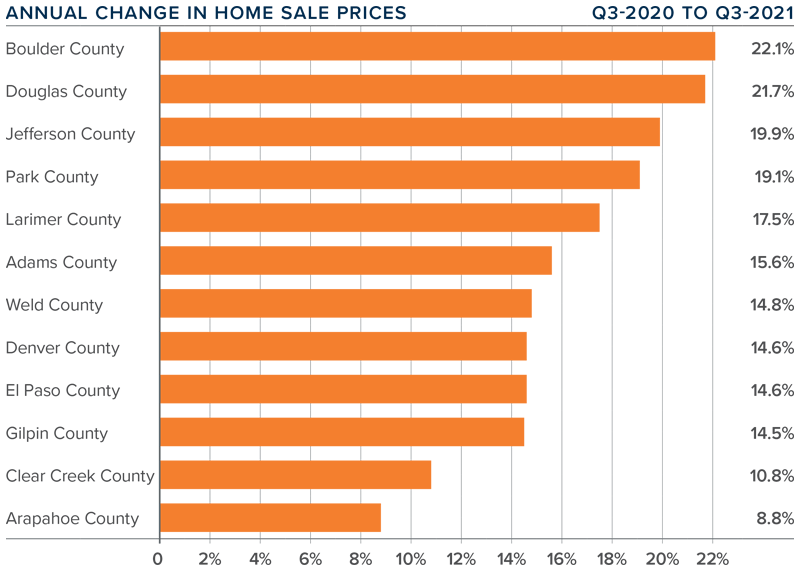
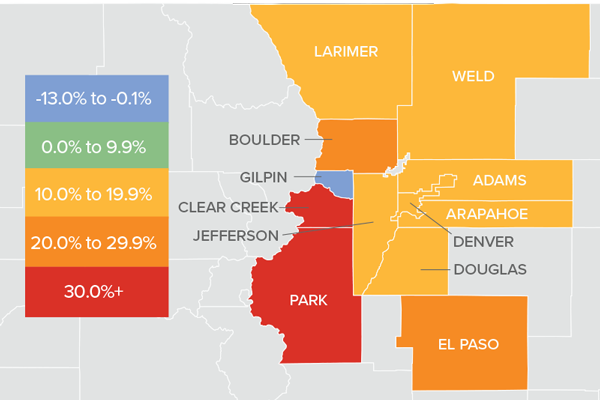
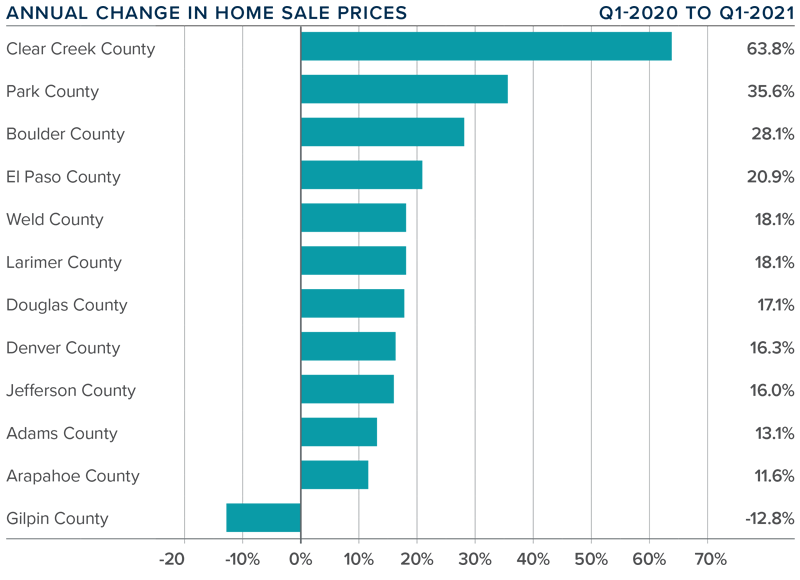
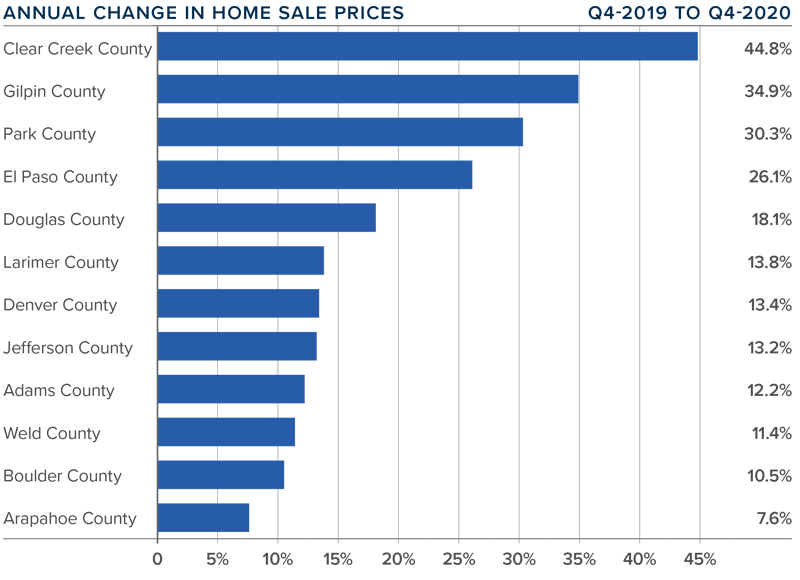
❱ Prices continue to appreciate at an impressive pace, recording an increase of 28.1% year over year to an average of $615,409. Home prices were also 10.7% higher than the first quarter of this year.
❱ Buyer demand remains very strong, likely exacerbated by the drop in mortgage rates in the second quarter and improving levels of inventory.
❱ Year-over-year, prices rose across all markets covered by this report, with the exception of Clear Creek County. Of the markets that saw prices rise, all did so by double digits, with very notable gains in Boulder, Gilpin, and Park counties.
❱ Affordability levels continue to trouble me, and the pace of price appreciation has to slow at some point. The market is clearly still out of balance, but as long as the credit quality of buyers remains high, I do not see any cause for concern.
DAYS ON MARKET
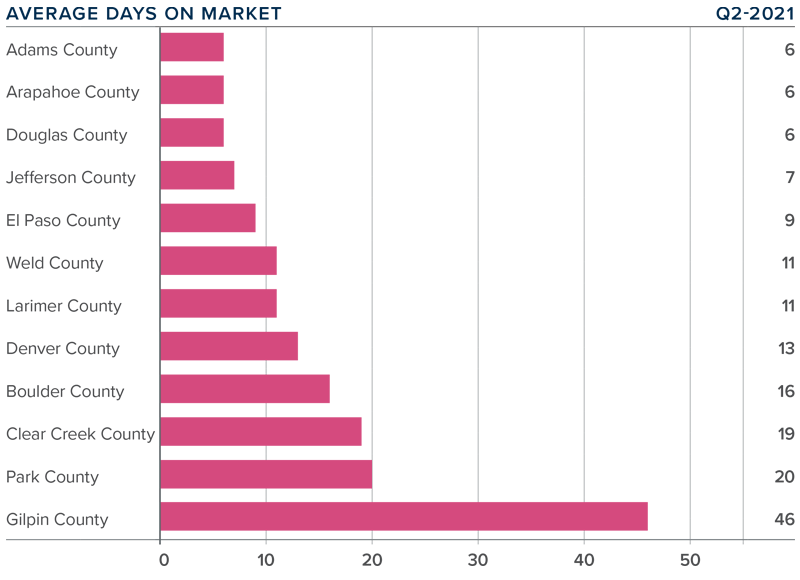
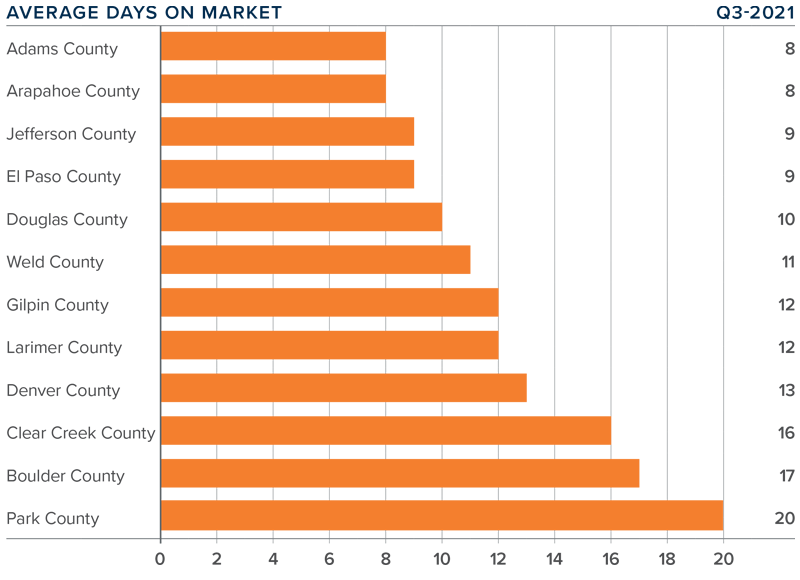
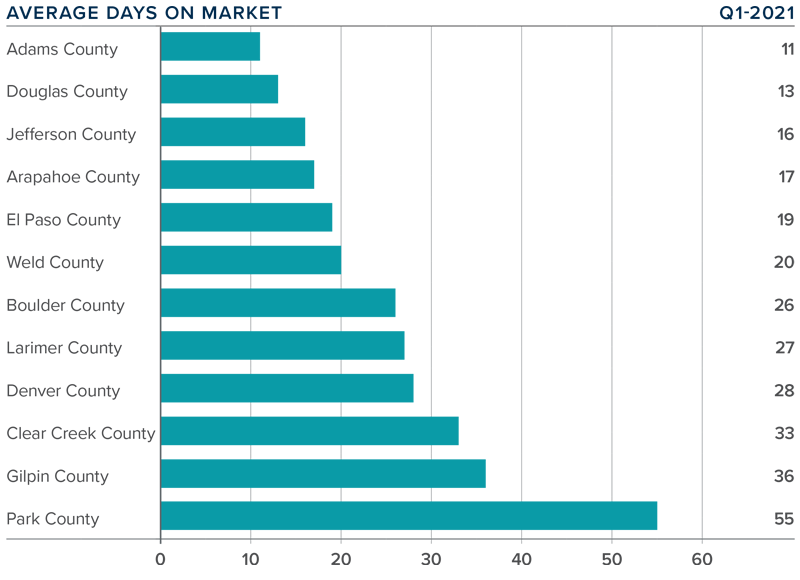
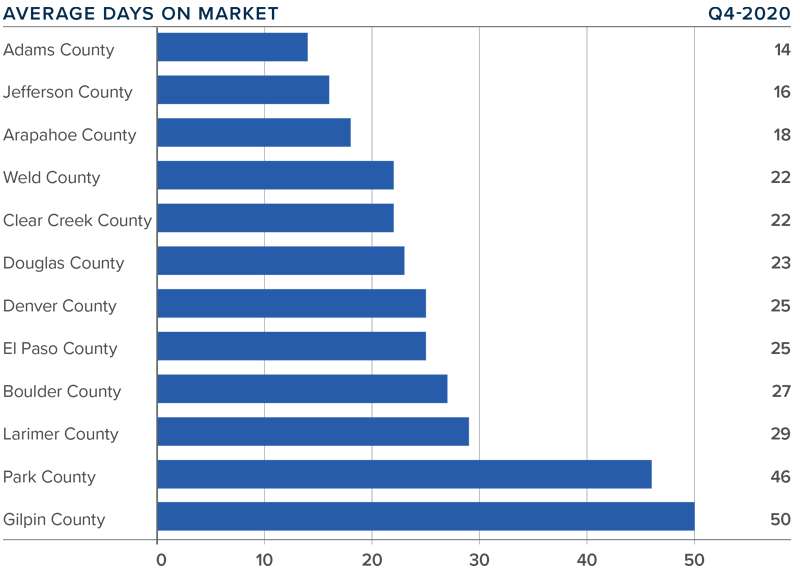
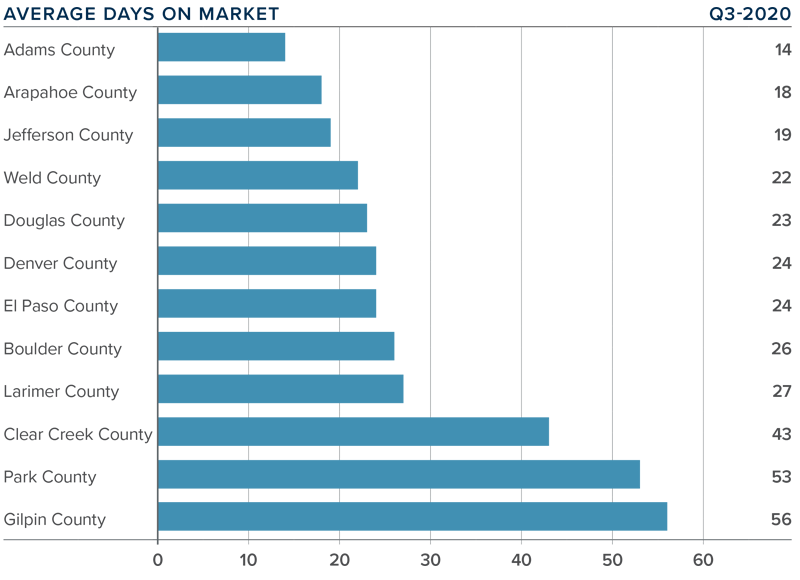
❱ The average number of days it took to sell a home in the markets contained in this report dropped 14 days compared to the second quarter of 2020.
❱ The amount of time it took to sell a home dropped in every county contained in this report compared to the second quarter of 2020. The exception was Gilpin County, where it rose by only two days.
❱ It took an average of only 14 days to sell a home in the region, which is down 11 days compared to the first quarter of this year.
❱ The Colorado housing market remains very tight, as demonstrated by the fact that it took less than a month for homes to sell in every county other than one.
CONCLUSIONS

This speedometer reflects the state of the region’s real estate market using housing inventory, price gains, home sales, interest rates, and larger economic factors.
Sales rose on the back of lower mortgage rates and higher levels of homes available to buy. Although this should signify a move back to a more balanced market, we are not there yet as price growth remains well above the long-term average.
With solid demand and favorable financing rates, the market is expected to remain active as we move through the balance of the year. That said, housing affordability is becoming an increasingly large concern. According to the Colorado Association of REALTORS®, statewide affordability for single-family homes has dropped almost 20% year-over-year and is down 17.8% for multi-family homes.
At some point, an affordability ceiling will be reached, which will slow home-price appreciation—but not yet. As such, I am moving the needle a little more in favor of home sellers, as they remain in the driver’s seat, for now.
ABOUT MATTHEW GARDNER

As Chief Economist for Windermere Real Estate, Matthew Gardner is responsible for analyzing and interpreting economic data and its impact on the real estate market on both a local and national level. Matthew has over 30 years of professional experience both in the U.S. and U.K.
In addition to his day-to-day responsibilities, Matthew sits on the Washington State Governors Council of Economic Advisors; chairs the Board of Trustees at the Washington Center for Real Estate Research at the University of Washington; and is an Advisory Board Member at the Runstad Center for Real Estate Studies at the University of Washington where he also lectures in real estate economics.
The post Q2 2021 Colorado Real Estate Market Update appeared first on Windermere Colorado REALTORS.


 -year to an average of $523,193. Prices were up 7.4% compared to the second quarter of this year.
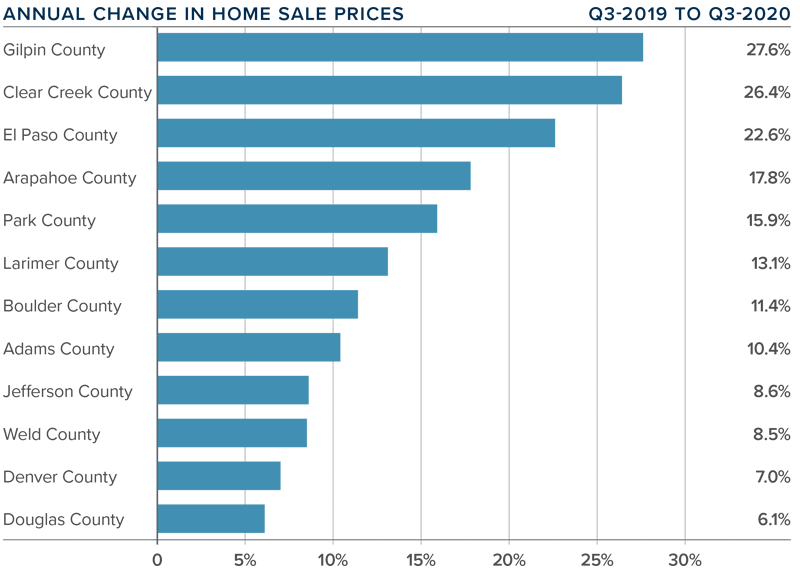
 This speedometer reflects the state of the region’s real estate market using housing inventory, price gains, home sales, interest rates, and larger economic factors.
 As Chief Economist for Windermere Real Estate, Matthew Gardner is responsible for analyzing and interpreting economic data and its impact on the real estate market on both a local and national level. Matthew has over 30 years of professional experience both in the U.S. and U.K.

 Home prices continue to trend higher, with the average home price in the region rising 6.7% year-over-year to $477,495.

 This speedometer reflects the state of the region’s real estate market using housing inventory, price gains, home sales, interest rates, and larger economic factors.
 As Chief Economist for Windermere Real Estate, Matthew Gardner is responsible for analyzing and interpreting economic data and its impact on the real estate market on both a local and national level. Matthew has over 30 years of professional experience both in the U.S. and U.K.