What to Consider When Buying an Equestrian Property

Buying a horse property is not your typical home purchase, especially for first time buyers. If you’ve never shopped for a horse property before, there is much to learn on the road to finding the best property for your needs. Working with an experienced Equestrian Advisor will also help ensure your home search and purchase go as smoothly as possible.

Horse Property Acreage
Just because a property has plentiful acreage doesn’t mean it will be suitable for horse care. The land must be flat-to-gently-sloped for grazing and provide adequate access to your horses’ basic needs. You want to look for properties with usable land – meaning there are not acres of unusable gullies, steep edges, or too many bodies of water that could make it difficult for your animals to navigate the property. Pay attention to local regulations about how much acreage is required per horse.

Zoning Instructions
If the property currently has horses or has in the past, do not assume it is an approved horse property. Part of your Equestrian Advisor’s job will be to ensure the property is in line with the local city, county, and/or HOA regulations for agriculture and livestock. Neglecting to verify the property could mean a significant financial setback if your horse property were the source of future legal issues and penalties.

Stable Inspections
When conducting the primary home inspection, be sure to have the barn and stables inspected as well. This could lead to higher upfront costs but skipping it could cause a huge headache later. Having a professional evaluate the barn and stables can reveal structural issues, electrical issues, or other potential problems that you would want to know about before you sign any paperwork.

Amenities
Housing horses and livestock on your property can be done with much more ease with a few convenient amenities. When touring prospective properties, look for the following:

  • Frost-proof spigots in the pasture, arena, and turnouts
  • Heated waterers in the stalls
  • Sufficient hay storage area
  • Tack room with a fridge for medication and supplements
  • Wash bay
  • Arena or training round pen

Your Routine
Transitioning to an equestrian lifestyle is a big adjustment, especially if this is your first time. Make sure you are taking your daily routine into consideration when looking at properties. How close are you to the barn? Where is the main water source? Careful planning every step of the way will make adapting to your new property much smoother and easier.

To connect with an experienced Equestrian Advisor today, click the link below:

Equestrian Advisor

The post What to Consider When Buying an Equestrian Property appeared first on Windermere Colorado REALTORS.

Q2 2021 Colorado Real Estate Market Update

The following analysis of the Metro Denver & Northern Colorado real estate market is provided by Windermere Real Estate Chief Economist Matthew Gardner. We hope that this information may assist you with making better-informed real estate decisions. For further information about the housing market in your area, please don’t hesitate to contact your Windermere Real Estate agent.

REGIONAL ECONOMIC OVERVIEW

Although the post COVID-19 job recovery took a step backward last winter, it has since picked up again, which is very pleasing to see. At the end of the second quarter, the state had recovered more than 276,000 of the 376,000+ jobs that were shed due to COVID-19. Even though employment levels are still almost 100,000 lower than the pre-pandemic peak, they are heading in the right direction. Looking at the markets contained in this report, current employment levels in Colorado Springs are only 2.2% below the pre-pandemic peak, followed by Denver and Fort Collins, which are both down 3.6% from the 2020 peak. I would add that all markets showed jobs continuing to return. With total employment levels rising, the unemployment rate stands at 6.2%, down from the pandemic peak of 12.1%. Regionally, unemployment levels range from a low of 4.8% in Boulder to a high of 6.3% in Grand Junction. COVID-19 infection rates dropped during the quarter, which is certain to lead to employment levels continuing to rise unless we see another significant increase in infection rates due to the rise of new variants across the country.


COLORADO HOME SALES

❱ The late spring/early summer market was a good one for home sales, which were up 33.9% from a year ago. Comparing the current quarter to a period when COVID-19 was widespread is not that informative, but, with sales up more than 55% from the first quarter of this year, the market appears to be very buoyant.

❱ Sales were higher in all counties other than the very small Clear Creek County. Where sales rose, they did so at double-digit rates in all markets other than Weld.

❱ During the second quarter, 13,428 homes sold. This is very impressive but not overly surprising, given that the average number of homes for sale was up 45% from the first quarter.

❱ Another positive was that pending sales, which are an indicator of future closings, were 42.8% higher than in the first quarter. This suggests that closings next quarter should be positive as well.
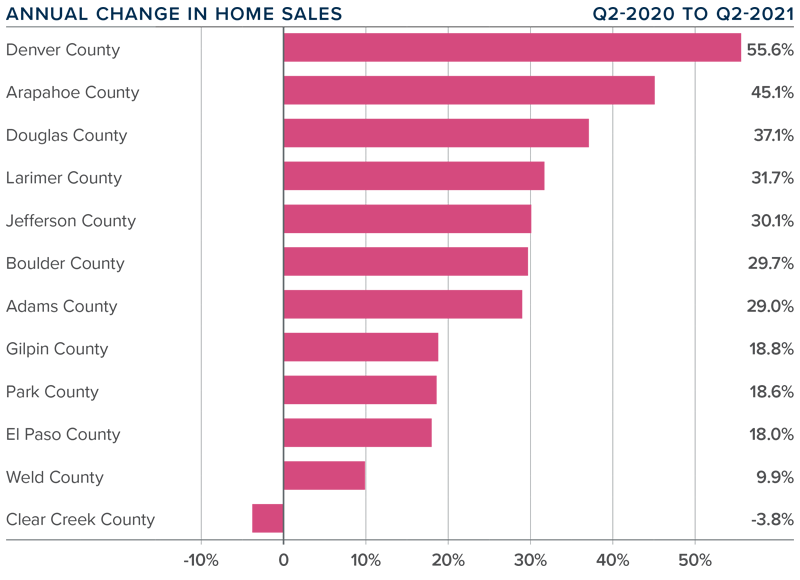
 

A bar graph showing the annual change in home sales for various counties in Colorado.


COLORADO HOME PRICES

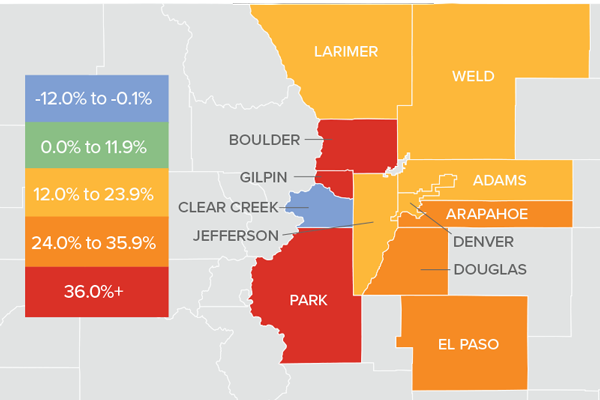
A map showing the real estate market percentage changes in various counties in Colorado.

❱ Prices continue to appreciate at an impressive pace, recording an increase of 28.1% year over year to an average of $615,409. Home prices were also 10.7% higher than the first quarter of this year.

❱ Buyer demand remains very strong, likely exacerbated by the drop in mortgage rates in the second quarter and improving levels of inventory.

❱ Year-over-year, prices rose across all markets covered by this report, with the exception of Clear Creek County. Of the markets that saw prices rise, all did so by double digits, with very notable gains in Boulder, Gilpin, and Park counties.

❱ Affordability levels continue to trouble me, and the pace of price appreciation has to slow at some point. The market is clearly still out of balance, but as long as the credit quality of buyers remains high, I do not see any cause for concern.
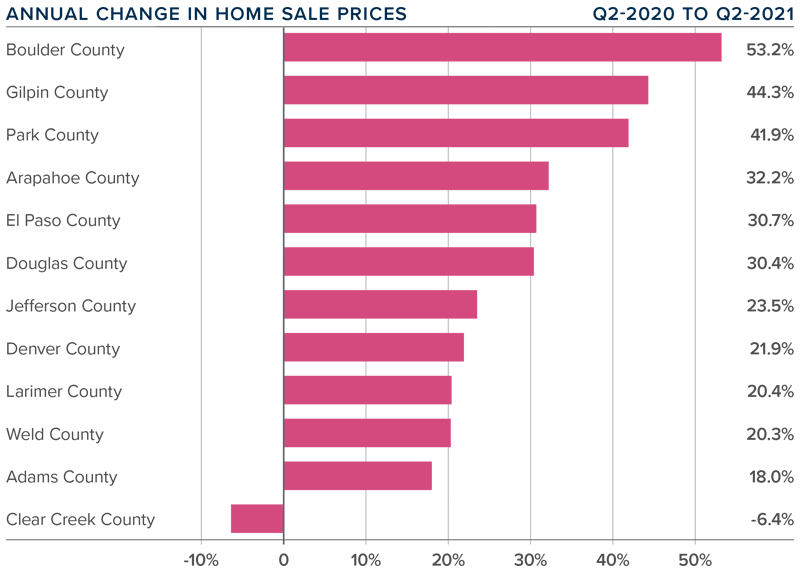
 

A bar graph showing the annual change in home sale prices for various counties is Colorado.


DAYS ON MARKET

❱ The average number of days it took to sell a home in the markets contained in this report dropped 14 days compared to the second quarter of 2020.

❱ The amount of time it took to sell a home dropped in every county contained in this report compared to the second quarter of 2020. The exception was Gilpin County, where it rose by only two days.

❱ It took an average of only 14 days to sell a home in the region, which is down 11 days compared to the first quarter of this year.

❱ The Colorado housing market remains very tight, as demonstrated by the fact that it took less than a month for homes to sell in every county other than one.
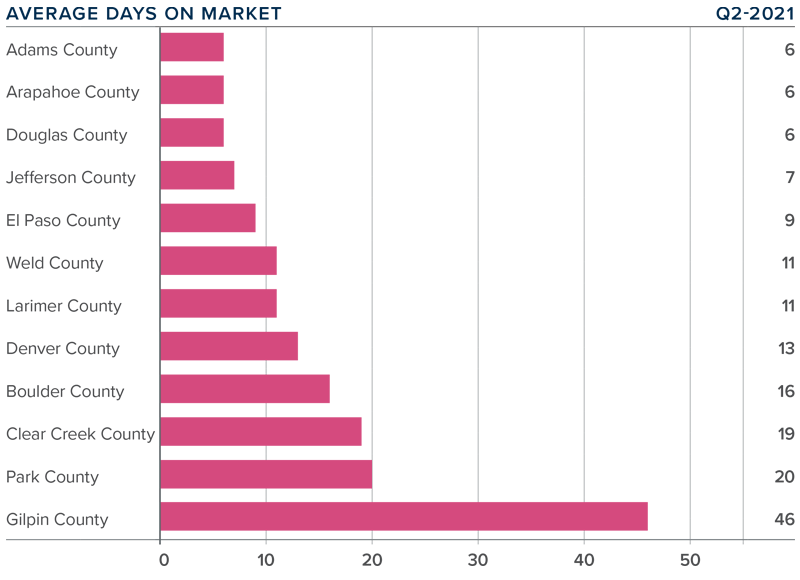
 

A bar graph showing the average days on market for homes in various counties in Colorado.


CONCLUSIONS

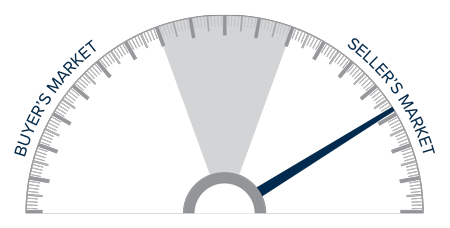
A speedometer graph indicating a seller's market in Colorado.

This speedometer reflects the state of the region’s real estate market using housing inventory, price gains, home sales, interest rates, and larger economic factors.
Sales rose on the back of lower mortgage rates and higher levels of homes available to buy. Although this should signify a move back to a more balanced market, we are not there yet as price growth remains well above the long-term average.

With solid demand and favorable financing rates, the market is expected to remain active as we move through the balance of the year. That said, housing affordability is becoming an increasingly large concern. According to the Colorado Association of REALTORS®, statewide affordability for single-family homes has dropped almost 20% year-over-year and is down 17.8% for multi-family homes.

At some point, an affordability ceiling will be reached, which will slow home-price appreciation—but not yet. As such, I am moving the needle a little more in favor of home sellers, as they remain in the driver’s seat, for now.


ABOUT MATTHEW GARDNER

Matthew Gardner - Chief Economist for Windermere Real Estate

As Chief Economist for Windermere Real Estate, Matthew Gardner is responsible for analyzing and interpreting economic data and its impact on the real estate market on both a local and national level. Matthew has over 30 years of professional experience both in the U.S. and U.K.

In addition to his day-to-day responsibilities, Matthew sits on the Washington State Governors Council of Economic Advisors; chairs the Board of Trustees at the Washington Center for Real Estate Research at the University of Washington; and is an Advisory Board Member at the Runstad Center for Real Estate Studies at the University of Washington where he also lectures in real estate economics.

The post Q2 2021 Colorado Real Estate Market Update appeared first on Windermere Colorado REALTORS.

100 / 90 / 60

As you’ve probably heard, prices have gone up quite a bit along the Front Range.

Low interest rates, strong demand, lower supply, and a healthy local economy are all contributing to increased prices.

It may interest you to see exactly how much prices have increased since one year ago in the markets where we have the most activity.

Over the last year, Weld County has increased roughly $100,000, Metro Denver $90,000 and Larimer County $60,000.

Specifically, here are the average prices one year ago vs. today:

  • Weld County = $426,000 vs. $523,000
  • Metro Denver = $523,000 vs. $612,000
  • Larimer County = $532,000 vs. $592,000

The post 100 / 90 / 60 appeared first on Windermere Colorado REALTORS.

Listing Averages

While a lot of attention has been paid to increasing sales prices along the Front Range, it is also interesting to look at the average price of properties currently listed for sale.

Did you know, for instance, that the average list price of all the properties currently for sale in Metro Denver is $887,000. Meanwhile, the average closed sales price is $613,000.

In Larimer County it is $793,000 versus an average closed sales price of $601,000.

In Weld County it is $669,000 versus $488,000.

What is causing this? The high number of high-end properties currently for sale pulling up the average.

You might be surprised to hear the number of $1,000,000-plus listings active listings in our market looks like this:

  • Metro Denver = 527
  • Larimer County = 75
  • Weld County = 44

The post Listing Averages appeared first on Windermere Colorado REALTORS.
2 to 3

Along the Front Range we have gone from two weeks of inventory to three weeks.

For much of the Spring, there was only two weeks of inventory on the market in most areas. Meaning, it would only take 14 days to sell all of the homes currently for sale.

Now, because the pace of sales has slightly slowed down and there is a bit more inventory, there is roughly three weeks.

We can actually measure inventory in number of days based on the pace of sales in July so far:

  • Metro Denver = 23 Days
  • Larimer County = 22 Days
  • Weld County = 22 Days

This is obviously good news for buyers as they have better selection and slightly less competition.

The post 2 to 3 appeared first on Windermere Colorado REALTORS.

The Impact of Staging Your Home

For more than 20 years, the benefits of staging a home have been well documented. Numerous studies show that staging helps sell a home faster and for a higher price. According to the National Association of REALTORS®, 88 percent of home buyers start their search online, forming impressions within three seconds of viewing a listing. When a home is well staged, it photographs well and makes the kind of the first impression that encourages buyers to take the next step.

Studies also indicate that buyers decide if they’re interested within the first 30 seconds of entering a home. Not only does home staging help to remove potential red flags that can turn buyers off, but it also helps them begin to imagine living there. Homes that are professionally staged look more “move-in ready” and that makes them far more appealing to potential buyers.

According to the Village Voice, staged homes sell in one-third less time than non-staged homes. Staged homes can also command higher prices than non-staged homes. Data compiled by the U.S. Department of Housing and Urban Development indicate that staged homes sell for approximately 17 percent more than non-staged homes.

A measurable difference in time and money

In a study conducted by the Real Estate Staging Association in 2007, a group of vacant homes that had remained unsold for an average of 131 days were taken off the market, staged, and relisted. The newly staged properties sold, on average, in just 42 days, – which is approximately 68 percent less time on the market.

The study was repeated in 2011, in a more challenging market, and the numbers were even more dramatic. Vacant homes that were previously on the market for an average of 156 days as unstaged properties, when listed again as staged properties, sold after an average of 42 days—an average of 73 percent less time on the market.

Small investments, big potential returns

Staging is a powerful advantage when selling your home, but that’s not the only reason to do it. Staging uncovers problems that need to be addressed, repairs that need to be made, and upgrades that should be undertaken. For a relatively small investment of time and money, you can reap big returns. Staged properties are more inviting, and that inspires the kind of peace-of-mind that gets buyers to sign on the dotted line. In the age of social media, a well-staged home is a home that stands out, gets shared, and sticks in people’s minds.

What’s more, the investment in staging can bring a higher price. According to the National Association of REALTORS, the average staging investment is between one percent and three percent of the home’s asking price, and typically generates a return of eight to ten percent.

In short, less time on the market and higher selling prices make the small cost of staging your home a wise investment.

Interested in learning more? Contact your real estate agent for information about the value of staging and referrals for professional home stagers.

The post The Impact of Staging Your Home appeared first on Windermere Colorado REALTORS.

Inventory Uptick

We are noticing a trend that is very good news for buyers.

Inventory has been increasing over the last month which means that buyers now have more properties to consider.

Just in the last week, the number of homes for sale has increased:

13% in Larimer County

12% in Weld County

11% in Metro Denver

If you are a buyer who has been waiting for home properties to look at, now is the time!

The post Inventory Uptick appeared first on Windermere Colorado REALTORS.
High Average

If you watch the weekly statistics that we produce and post on social media, a number that might be jumping off the screen at you is the average price.

Specifically, it is the percentage increase in average price versus last year that is striking.

We are commonly asked ‘how could average prices increase 20% to 30% in one year?’

It is important to note prices haven’t appreciated up to 30%, it’s only the average price that has increased by that amount.

A key reason why average prices have increased by such a significant amount is that there are many more luxury properties selling this year versus last year.

Sales of properties priced over $1,000,000 have seen a substantial increase compared to 2020.

Look at these numbers which show the year over year increase in closed transactions for real estate priced over $1 million:

  • Larimer County = 159%
  • Weld County = 247%
  • Metro Denver = 137%

So, transactions of luxury properties have much more than doubled compared to 2020 which is pulling up the average sales price in a significant way.

The post High Average appeared first on Windermere Colorado REALTORS.

Words Matter

A common phrase that is being used right now to describe the market is ‘no inventory.’

‘There’s no inventory’ is said frequently among those inside and outside of the real estate industry.

The problem with this phrase is that it is untrue.

There is inventory.  Meaning, there are a significant number of new listings hitting the market.

However, there is low standing inventory.  Meaning, the listings that do hit the market don’t stick around for very long before they are purchased.

Standing inventory, which is the number of active properties on the market, is down roughly 70% along the Front Range.

However, the number of new listings coming on the market is essentially:

  • Double compared to December 2020
  • Only 20% to 25% less than this time of year in 2017, 2018, and 2019

So, there is inventory available, it just sells quickly because demand is historically high right now.

The post Words Matter appeared first on Windermere Colorado REALTORS.

Calculated Risk

The economic research blog called “Calculated Risk” just completed a fascinating study on home prices.

Specifically, they looked at the correlation between home price growth and inventory.

They used price data from the Case-Shiller Home Price Index and inventory data from the National Association of Realtors.

No surprise, they found that the lower the inventory the higher the home price growth. Also no surprise, as inventory goes up, price growth slows down.

This all correlates with simple economic rules of supply and demand.

The interesting part of their research is this: at a certain level of inventory, prices have the potential to go down.

That level, according to their research, is six months of inventory.

That means, prices don’t have a chance of decreasing in a market until there is at least 6 months of inventory available for sale.

To put that in perspective, today there is two weeks of inventory on the market along the Front Range.

So, there would need to be 12 times the amount of homes for sale on the market for prices to even have a chance to go down.

The post Calculated Risk appeared first on Windermere Colorado REALTORS.